Creates a Regional Hydraulic Dimension graph for the regions provided for the specified dimension.
![[Stable]](figures/lifecycle-stable.svg)
region_dimension_graph(
  regions,
  dimension_type = c("area", "depth", "width", "discharge")
)
Arguments
Value
A ggplot object.
Details
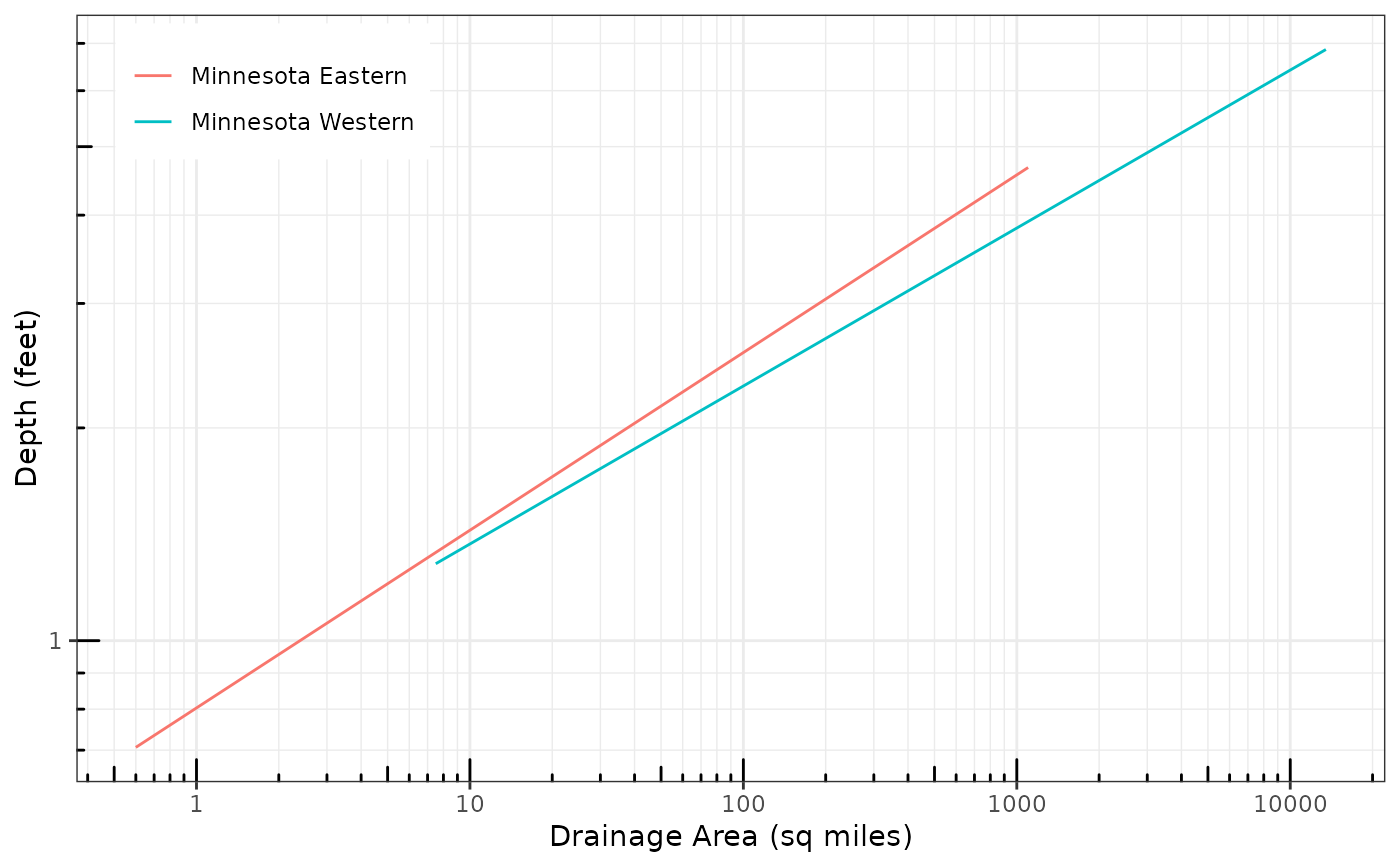
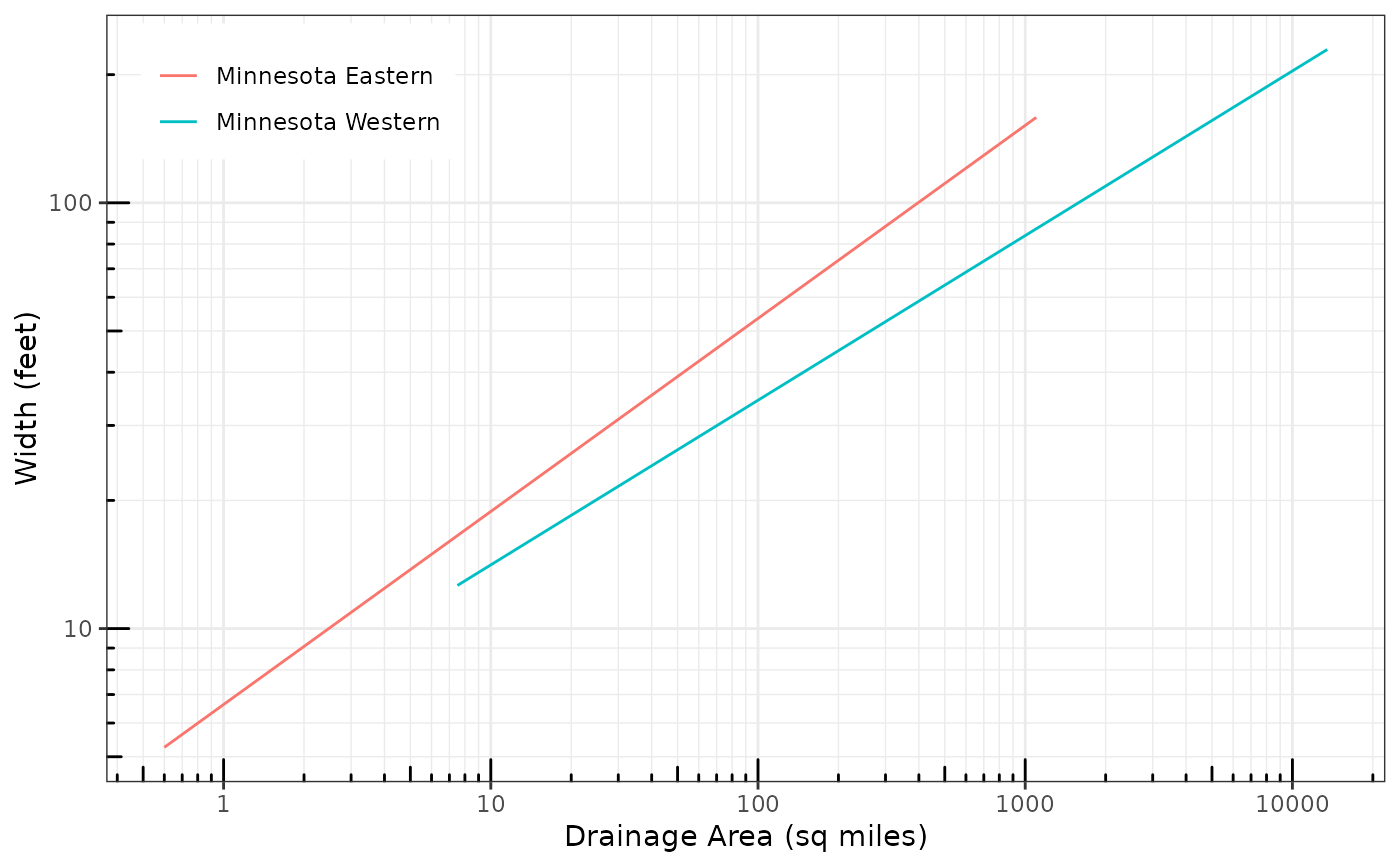
Creates a regional hydraulic dimension graph styled using conventions that have emerged in the fluvial geomorphic literature:
Drainage Area as the independent variable on the x-axis. Units are expressed in imperial units (square miles).
Hydraulic dimensions (i.e., width, depth, cross sectional area, discharge) as the dependent variables on the y-axis. Units are expressed in imperial units(i.e, width: feet, depth: feet, cross sectional area: square feet, discharge: cubic feet per second).
Both axes on log scale (aka "log-log graph").
See also
Other visualizations:
region_graph()
Examples
regions = c("Minnesota Eastern", "Minnesota Western")
dimension_type = "width"
region_dimension_graph(regions, dimension_type)


region_dimension_graph(regions, "depth")