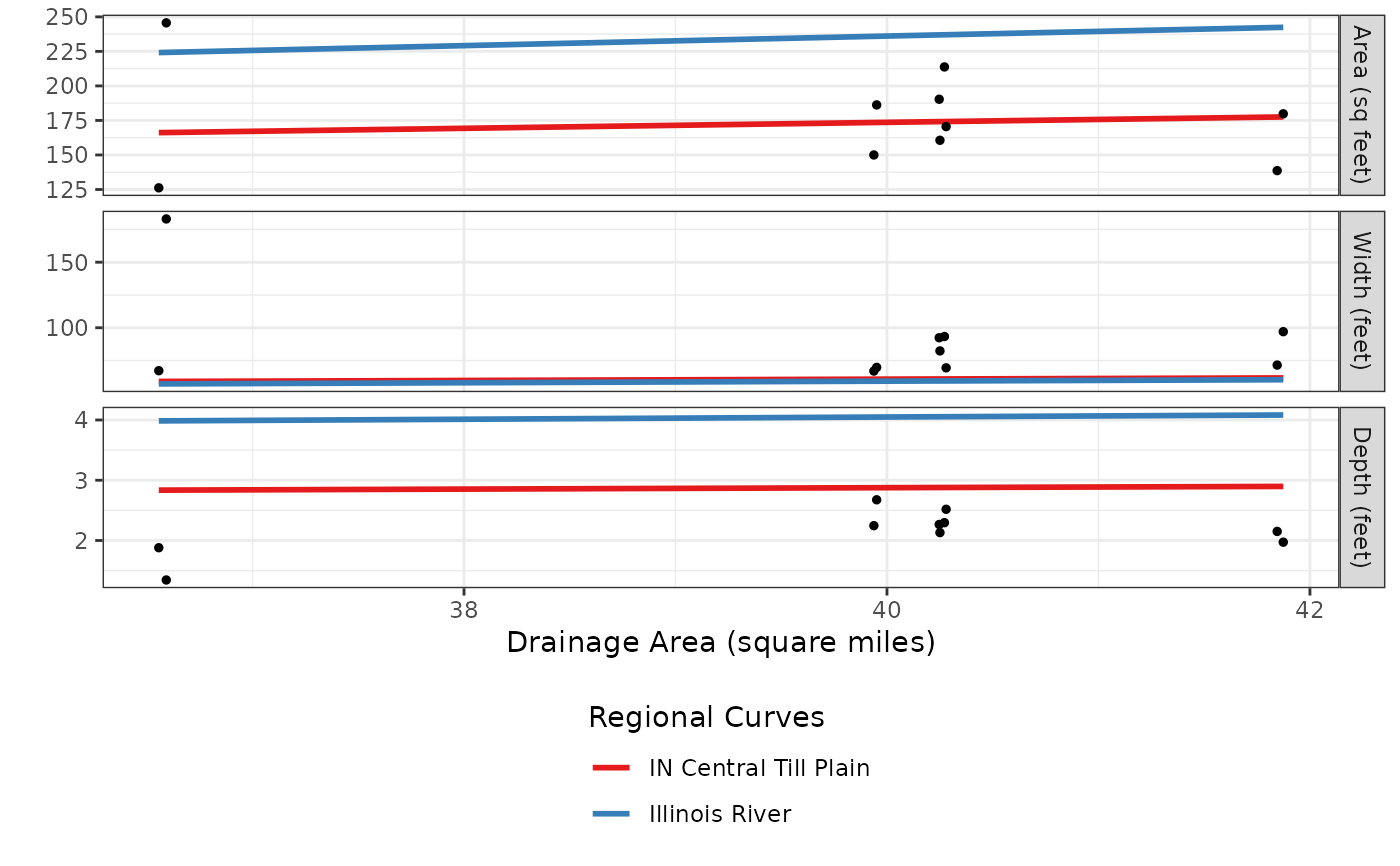
Produces a regional hydraulic geometry graph for the specified streams.
reach_rhg_graph(
  xs_dims,
  streams,
  bf_elevation,
  xs_trend = FALSE,
  log_scale = FALSE
)
Arguments
- xs_dims
data frame; a data frame of cross section dimensions generated using `fluvgeo::xs_dimensions`.
- streams
character vector; The stream names in the study area. If a single value, then only that stream will be displayed. If a vector of stream names is specified all streams in the vector will be displayed.
- bf_elevation
numeric vector; The bankfull elevations (units: detrended feet) that are used to calculate hydraulic geometry.
- xs_trend
logical; Smooth trend line?
- log_scale
logical; Convert scales to log?
Value
A ggplot object.
Examples
# Extract attribute data from the fluvgeo::sin_xs_points sf
sin_xs_points_df <- fluvgeo::sin_riffle_channel_points_sf

# Set variable values
streams <- "Sinsinawa"
regions <- c("Illinois River", "IN Central Till Plain")
bankfull_elevations <- seq(103, 104, 0.1)

# Call the xs_dimensions function
sin <- xs_dimensions(xs_points = sin_xs_points_df,
                     streams = streams,
                     regions = regions,
                     bankfull_elevations = bankfull_elevations)

# Call the reach_rhg_graph function
sin_reach_rhg_graph <- reach_rhg_graph(xs_dims = sin,
                                       streams = streams,
                                       bf_elevation = bankfull_elevations)

# Print the reach_rhg_graph
print(sin_reach_rhg_graph)
