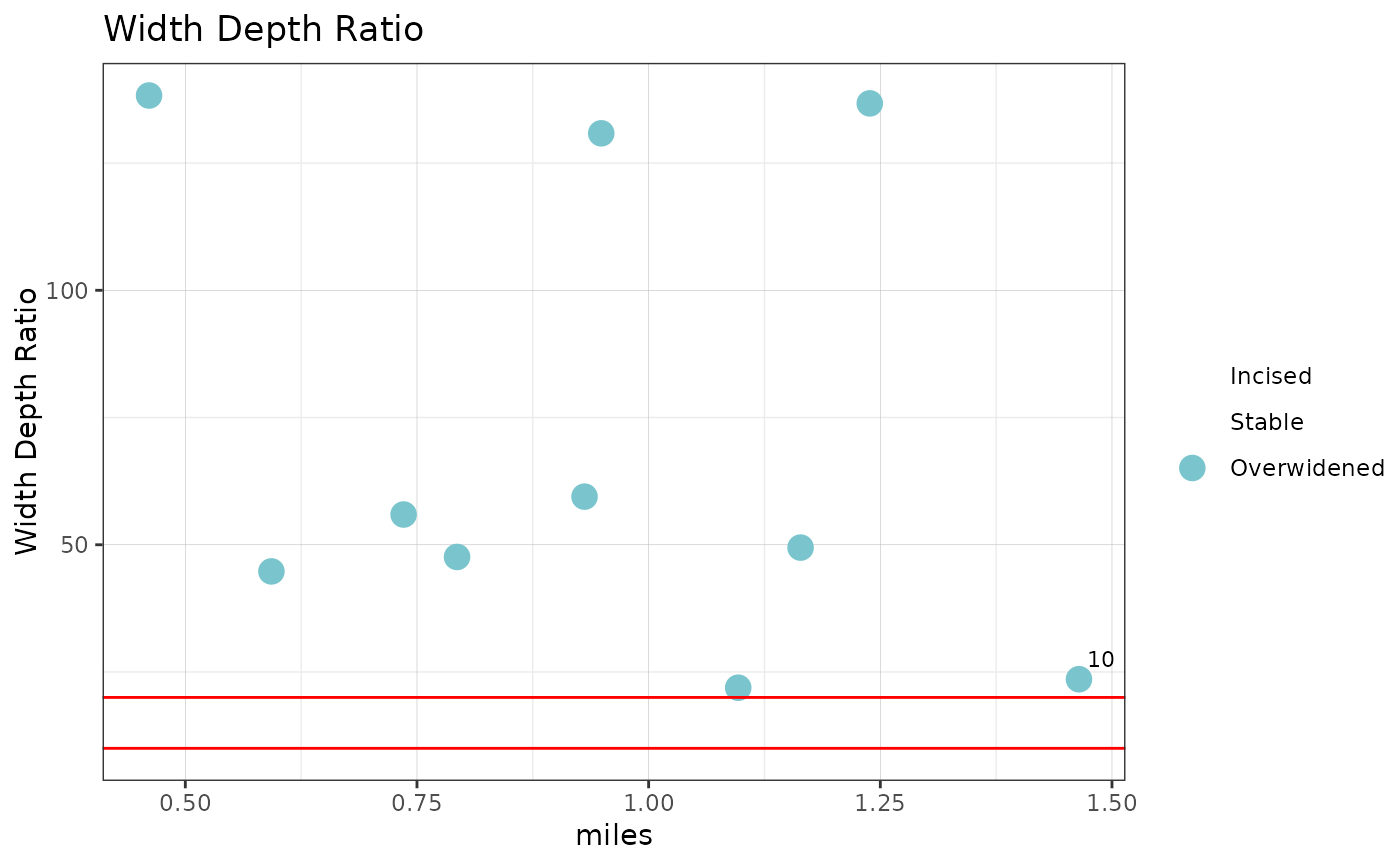
Produces a longitudinal plot of cross section metrics for the input stream reach.
xs_metric_plot(
  metric,
  reach_xs_dims,
  label_xs = TRUE,
  xs_label_freq = 10,
  profile_units = "kilometers"
)
Arguments
- metric
FluvialGeomorphicMetric object; the fluvial geomorphic metric to be mapped
- reach_xs_dims
data frame; a data frame of cross section dimensions.
- label_xs
logical; Draw the cross section locations?
- xs_label_freq
numeric; An integer indicating the frequency of cross section labels.
- profile_units
character; the units of the longitudinal profile. One of "kilometers", "meters", "miles", or "feet"
Value
A ggplot2 object.
See also
The xs_metrics_plot function requires a xs_dimensions
dataframe. See the sin_xs_dimensions package dataset for an
example of this format of cross section data produced by the
FluvialGeomorph ArcGIS toolbox.
Examples
# Get feature class test data
xs_planform_fc <- file.path(system.file("extdata", "testing_data.gdb",
                                        package = "fluvgeodata"),
                            "feature_dataset/riffle_floodplain_dims_L3")

# Convert feature classes to an sf objects
xs_planform_sf   <- fluvgeo::fc2sf(xs_planform_fc)
#> Reading layer `riffle_floodplain_dims_L3' from data source
#>   `/home/runner/work/_temp/Library/fluvgeodata/extdata/testing_data.gdb'
#>   using driver `OpenFileGDB'
#> Simple feature collection with 10 features and 73 fields
#> Geometry type: MULTILINESTRING
#> Dimension:     XY
#> Bounding box:  xmin: 706175.9 ymin: 4705488 xmax: 706792.8 ymax: 4706597
#> Projected CRS: NAD83 / UTM zone 15N

# Create the fluvgeo::FluvialGeomorphicMetric object
wdr <- new(Class = "FluvialGeomorphicMetric",
           metric = "Width Depth Ratio",
           definition = "bankfull width / bankfull depth",
           variable = "xs_width_depth_ratio",
           threshold_breaks = c(0, 10, 20, Inf),
           threshold_labels = c("Incised",
                                "Stable",
                                "Overwidened"),
           source = "Dunn & Leopold, 1978")

metric_plot <- fluvgeo::xs_metric_plot(metric = wdr,
                                       reach_xs_dims = xs_planform_sf,
                                       label_xs = TRUE,
                                       profile_units = "miles")
print(metric_plot)
