9 Reports
FluvialGeomorph produces a series of reports that help to define stream conditions.
Graph - Longitudinal Profile Compare
This graph is produced using the Graph - Longitudinal Profile Compare tool.
Report - L1
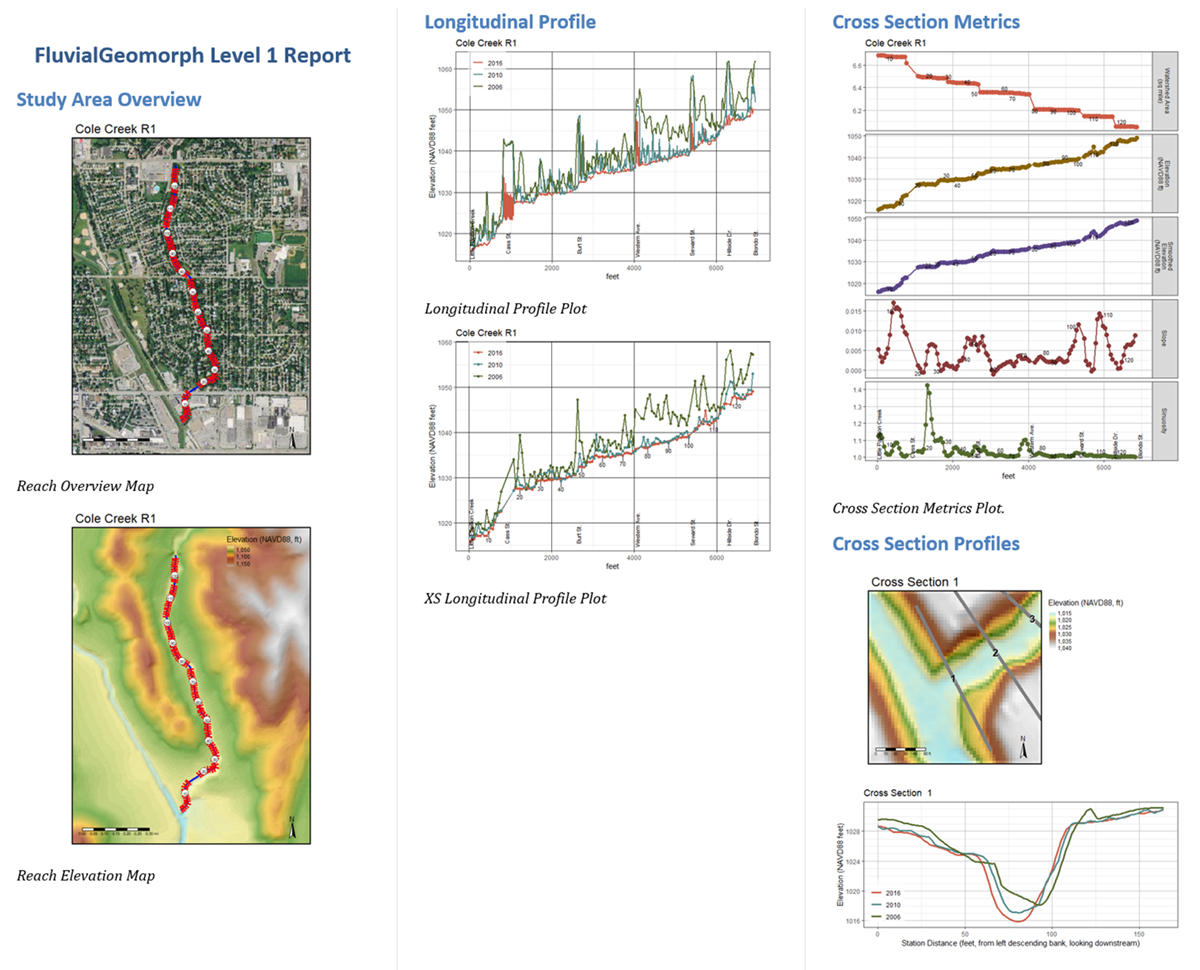
Purpose - The Level 1 Report contains a set of maps and graphs that describe the channel as measured from the LiDAR derived DEM. This report is produced using the Report - L1 tool using these instructions from the user manual.
Code - This report is created by the R Markdown parameterized report in the R package fluvgeo/reports/level_1_report.Rmd.
This report contains the following sections:
- Study Area Overview - This section provides an overview of the study area reach.
- Reach Overview Map - A reach overview map displaying cross section locations over an aerial image and/or a medium resolution DEM with multi-direction shaded relief. This figure is produced by the R function
fluvgeo::map_reach_overview.
- Reach Overview Map - A reach overview map displaying cross section locations over an aerial image and/or a medium resolution DEM with multi-direction shaded relief. This figure is produced by the R function
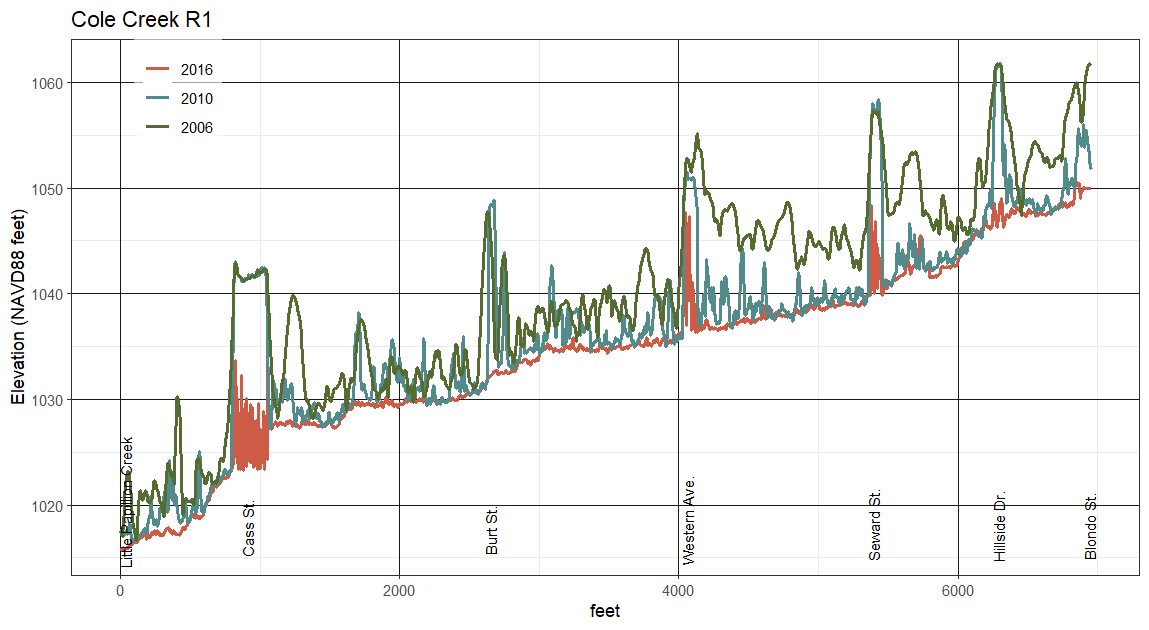
- Longitudinal Profile - This section displays the elevation (y-axis) of the stream reach along its length (x-axis) beginning from the downstream end of the reach moving upstream (typically referred to as a longitudinal profile).
- Longitudinal Profile - This longitudinal profile graph is created from the
flowline_pointsfeature class for several surveys if available. This figure is produced by the R functionfluvgeo::compare_long_profile.R.
- XS Longitudinal Profile - This longitudinal profile graph is created using a regular cross sections feature class. This figure is produced by the R function
fluvgeo::compare_xs_long_profile.
- Longitudinal Profile - This longitudinal profile graph is created from the
- Cross Section Metrics - This section displays metrics for the cross sections of a stream reach.
- Cross Section Metrics Plot, Level 1 - This stream reach metrics graph displays the Level 1 metrics on a faceted graph. This figure is produced by the R function
fluvgeo::xs_metrics_plot_L1.
- Cross Section Metrics Plot, Level 1 - This stream reach metrics graph displays the Level 1 metrics on a faceted graph. This figure is produced by the R function
- Cross Section Profiles - This section displays a focused view of the characteristics of each individual cross section in the stream reach.
- Cross Section Map - This map displays the extent of a single cross section in plan view with a DEM background. This figure is produced by the R function
fluvgeo::map_xs. - Cross Section Profile Compare Plot - This graph displays a single regularly spaced cross section in profile view comparing the elevations from multiple surveys if provided. This figure is produced by the R function
fluvgeo::xs_compare_plot_L1.
- Cross Section Map - This map displays the extent of a single cross section in plan view with a DEM background. This figure is produced by the R function
Report - L2 Estimate Bankfull
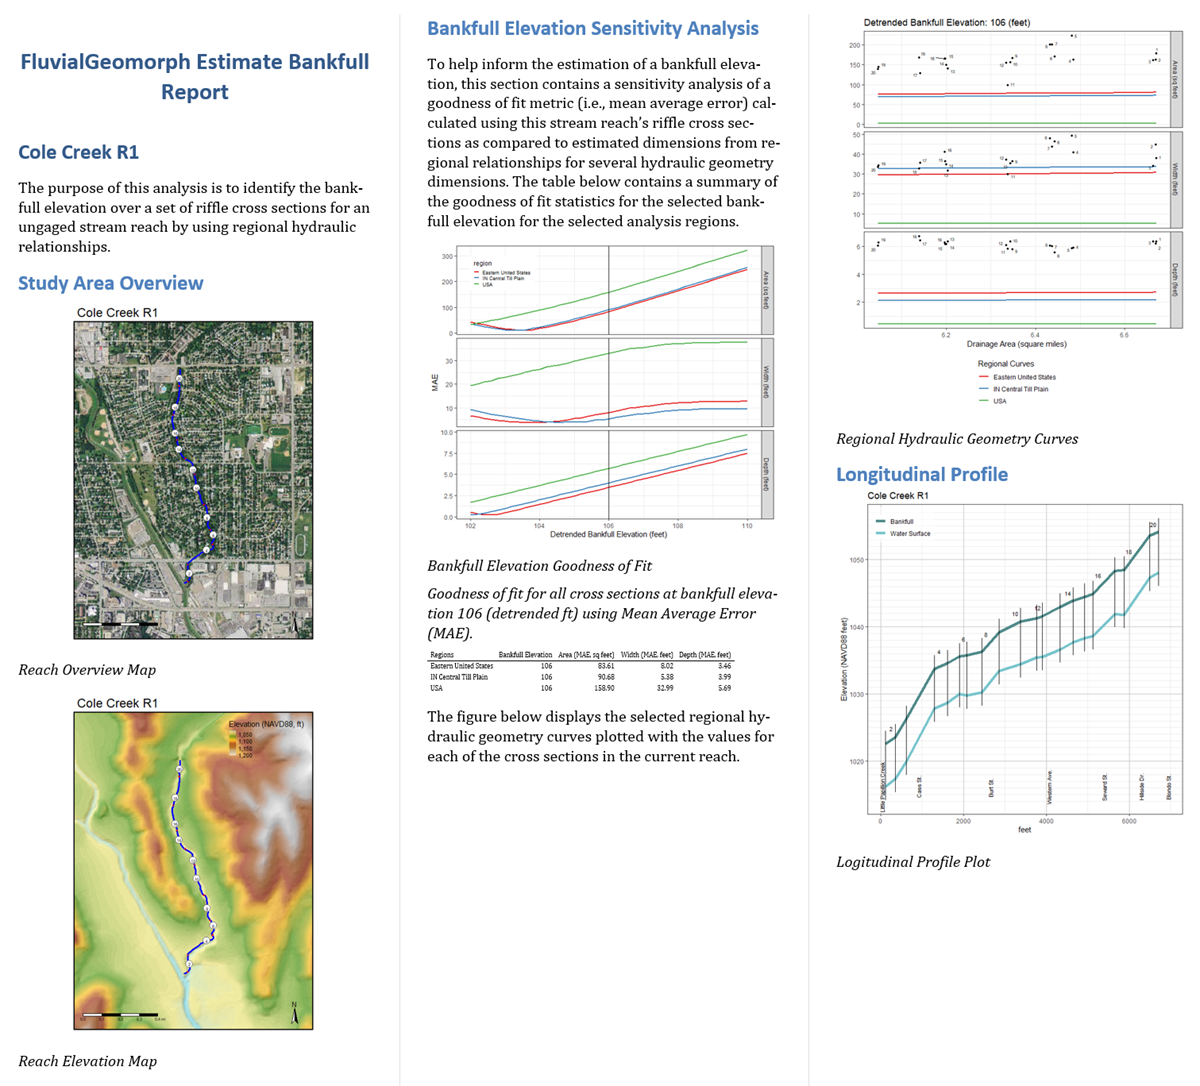
Purpose - The Estimate Bankfull Report is used to help estimate the bankfull water surface elevation for an ungaged stream with the assistance of regional curves and visual observation of geomorphic indicators from LiDAR surveys. This report is produced using the Report - L2 Estimate Bankfull tool using these instructions from the user manual.
Code - This report is created by the R Markdown parameterized report in the R package fluvgeo/reports/estimate_bankfull_report.Rmd.
This report contains the follow sections:
- Study Area Overview - This section provides an overview of the study area reach.
- Reach Overview Map - A reach overview map displaying cross section locations over an aerial image and/or a medium resolution DEM with multi-direction shaded relief. This figure is produced by the R function
fluvgeo::map_reach_overview.
- Reach Overview Map - A reach overview map displaying cross section locations over an aerial image and/or a medium resolution DEM with multi-direction shaded relief. This figure is produced by the R function
- Bankfull Elevation Sensitivity Analysis - This section performs a sensitivity analysis of the directly measured reach-wide channel dimensions compared to the regional curve estimated channel dimensions.
- Bankfull Elevation Goodness of Fit Graph - This graph is used to identify how similar this reach’s dimensions are compared to dimensions from several other regions at the current bankfull estimate. This figure is produced by the R function
fluvgeo::gof_graph. - Bankfull Elevation Dimensions by Region Table - This table summarizes this reach’s dimensions compared to several other regions at the current bankfull elevation. This table is created by code in the Estimate Bankfull Report,
fluvgeo/reports/estimate_bankfull_report.Rmd - Regional Hydraulic Geometry Curves Graph - This graph displays the channel dimensions of each cross section in the reach, along with the regional curve estimated dimensions. This figure is produced by the R function
fluvgeo::reach_rhg_graph.
- Bankfull Elevation Goodness of Fit Graph - This graph is used to identify how similar this reach’s dimensions are compared to dimensions from several other regions at the current bankfull estimate. This figure is produced by the R function
- Longitudinal Profile - This section displays the elevation (y-axis) of the stream reach along its length (x-axis) beginning from the downstream end of the reach moving upstream (typically referred to as a longitudinal profile).
- XS Longitudinal Profile - This longitudinal profile graph is created using a
riffle_channelfeature class for the survey used to generate the bankfull estimate. This figure is produced by the R functionfluvgeo::xs_profile_plot.
- XS Longitudinal Profile - This longitudinal profile graph is created using a
- Cross Section Metrics - This section displays metrics the Level 2 metrics for the riffle cross sections of a stream reach.
- Cross Section Metrics Plot, Level 2 - This stream reach metrics graph displays the Level 2 metrics on a faceted graph. This figure is produced by the R function
fluvgeo::xs_metrics_plot_L2.
- Cross Section Metrics Plot, Level 2 - This stream reach metrics graph displays the Level 2 metrics on a faceted graph. This figure is produced by the R function
- Cross Section Profiles - This section displays a focused view of the characteristics of each individual cross section in the stream reach.
- Cross Section Map - This map displays the extent of a single cross section in plan view with a high resolution DEM background. This figure is produced by the R function
fluvgeo::map_xs. - Floodplain XS Profile Compare Plot - This graph displays a single
riffle_floodplainfeature in a wide aspect ratio profile view to compare the elevations from multiple surveys if provided. This figure is produced by the R functionfluvgeo::xs_compare_plot_L2. - Channel XS Profile Compare Plot - This graph displays a single
riffle_channelfeature in a square aspect ratio profile view to compare the elevations from multiple surveys if provided. This figure is produced by the R functionfluvgeo::xs_compare_plot_L2. - Bankfull Elevation Dimensions by Region Table - This table summarizes this cross section’s dimensions compared to several other regions at the current bankfull elevation. This table is created by code in the Estimate Bankfull Report,
fluvgeo/reports/estimate_bankfull_report.Rmd.
- Cross Section Map - This map displays the extent of a single cross section in plan view with a high resolution DEM background. This figure is produced by the R function
Report - L2
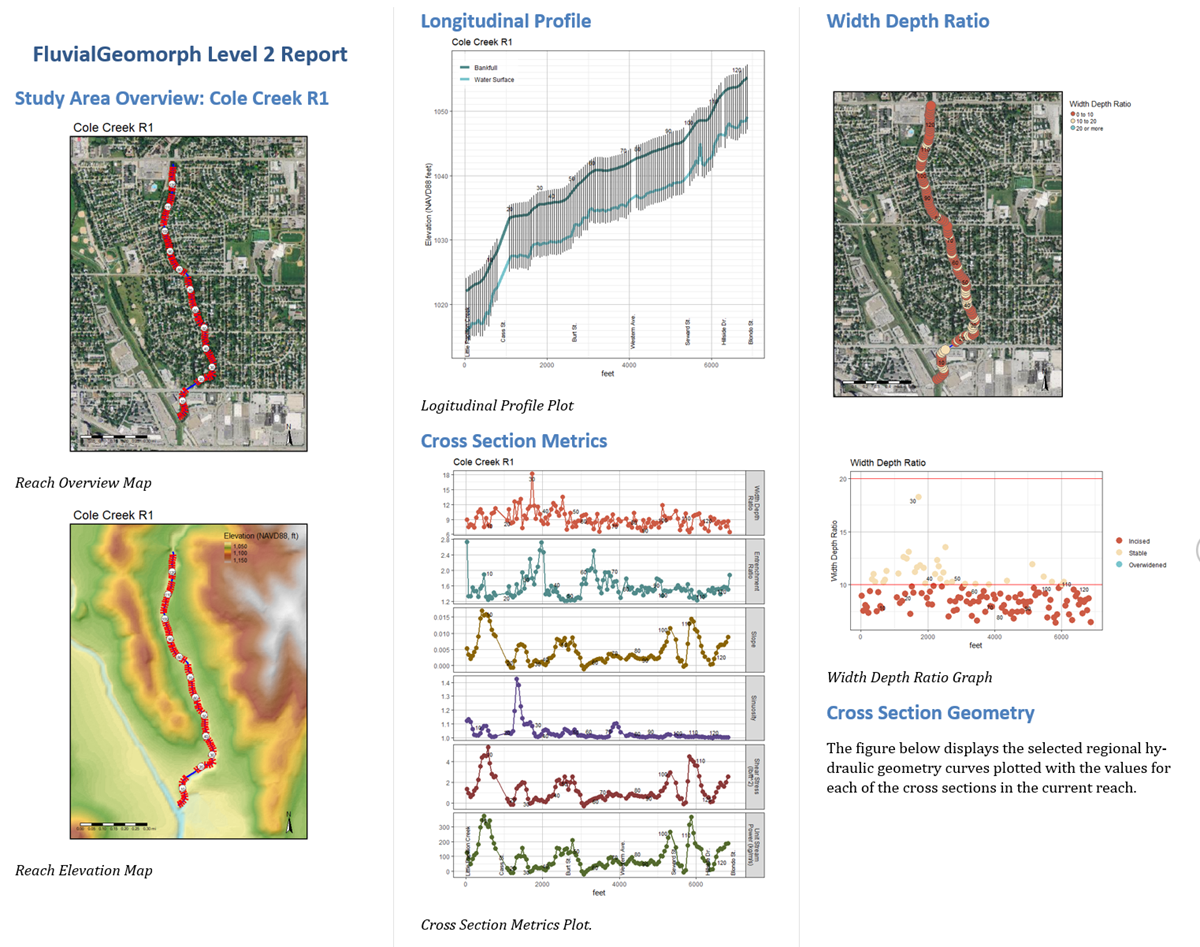
Purpose - The Level 2 Report contains a set of maps and graphs that describe the Level 2 channel dimensions calculated at the specified bankfull elevation, estimated using the L2 Estimate Bankfull Report. This report is produced using the Report - L2 tool using these instructions from the user manual.
Code - This report is created by the R Markdown parameterized report in the R package fluvgeo/reports/level_2_report.Rmd.
This report contains the following sections:
- Study Area Overview - This section provides an overview of the study area reach.
- Reach Overview Map - A reach overview map displaying cross section locations over an aerial image and/or a medium resolution DEM with multi-direction shaded relief. This figure is produced by the R function
fluvgeo::map_reach_overview.
- Reach Overview Map - A reach overview map displaying cross section locations over an aerial image and/or a medium resolution DEM with multi-direction shaded relief. This figure is produced by the R function
- Longitudinal Profile - This section displays the elevation (y-axis) of the stream reach along its length (x-axis) beginning from the downstream end of the reach moving upstream (typically referred to as a longitudinal profile).
- XS Longitudinal Profile - This longitudinal profile graph is created using a Level 2 cross section dimensions feature class for the survey used to generate the bankfull estimate. This figure is produced by the R function
fluvgeo::xs_profile_plot.
- XS Longitudinal Profile - This longitudinal profile graph is created using a Level 2 cross section dimensions feature class for the survey used to generate the bankfull estimate. This figure is produced by the R function
- Cross Section Metrics - This section displays metrics for the Level 2 dimensions calculated for the regular cross sections of a stream reach.
- Cross Section Metrics Plot, Level 2 - This stream reach metrics graph displays the Level 2 metrics on a faceted graph. This figure is produced by the R function
fluvgeo::xs_metrics_plot_L2. - Width Depth Ratio Map - A reach overview map is used to display the width depth ratio values at each cross section for the reach. The width depth ratio parameters (i.e., metric definition, class break values and labels) are defined in this report using the R S4 class
FluvialGeomorphicMetric. This figure is produced by the R functionfluvgeo::map_reach_metric. - Width Depth Ratio Graph - This graph displays the width depth ratio values (y-axis) of the stream along its length (x-axis) beginning from the downstream end of the reach moving upstream longitudinally. This graph uses the metric class definition for width depth ratio defined for the previous figure. This figure is produced by the R function
fluvgeo::xs_metric_plot. - Regional Hydraulic Geometry Curves Graph - This graph displays the channel dimensions of each cross section in the reach, along with the regional curve estimated dimensions. This figure is produced by the R function
fluvgeo::reach_rhg_graph.
- Cross Section Metrics Plot, Level 2 - This stream reach metrics graph displays the Level 2 metrics on a faceted graph. This figure is produced by the R function
- Cross Section Profiles - This section displays a focused view of the characteristics of each individual cross section in the stream reach.
- Cross Section Map - This map displays the extent of a single cross section in plan view with a high resolution DEM background. This figure is produced by the R function
fluvgeo::map_xs. - Regular XS Profile Compare Plot - This graph displays a single
*_L2_dimsfeature in a wide aspect ratio profile view to compare the elevations from multiple surveys if provided. This figure is produced by the R functionfluvgeo::xs_compare_plot_L2. - Bankfull Elevation Dimensions by Region Table - This table summarizes this cross section’s dimensions compared to several other regions at the current bankfull elevation. This table is created by code in the L2 Report,
fluvgeo/reports/level_2_report.Rmd.
- Cross Section Map - This map displays the extent of a single cross section in plan view with a high resolution DEM background. This figure is produced by the R function
Report - L3
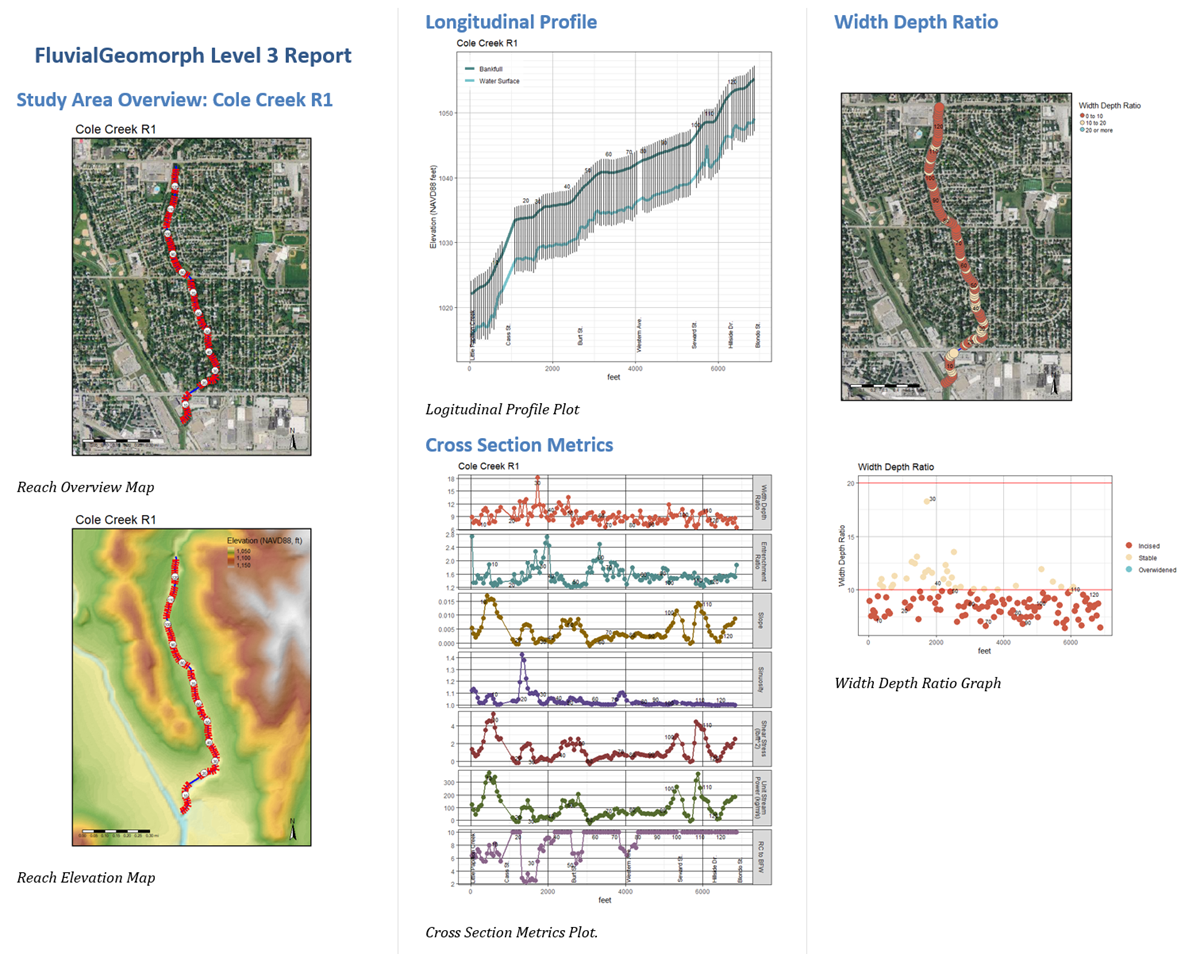
Purpose - The Level 3 Report contains a set of maps and graphs that describe the Level 3 channel dimensions calculated at the specified bankfull elevation, estimated using the L2 Estimate Bankfull Report. This report is produced using the Report - L3 tool using these instructions from the user manual.
Code - This report is created by the R Markdown parameterized report in the R package fluvgeo/reports/level_3_report.Rmd.
This report contains the following sections:
- Study Area Overview - This section provides an overview of the study area reach.
- Reach Overview Map - A reach overview map displaying cross section locations over an aerial image and/or a medium resolution DEM with multi-direction shaded relief. This figure is produced by the R function
fluvgeo::map_reach_overview.
- Reach Overview Map - A reach overview map displaying cross section locations over an aerial image and/or a medium resolution DEM with multi-direction shaded relief. This figure is produced by the R function
- Longitudinal Profile - This section displays the elevation (y-axis) of the stream reach along its length (x-axis) beginning from the downstream end of the reach moving upstream (typically referred to as a longitudinal profile).
- XS Longitudinal Profile - This longitudinal profile graph is created using a Level 3 cross section dimensions feature class for the survey used to generate the bankfull estimate. This figure is produced by the R function
fluvgeo::xs_profile_plot.
- XS Longitudinal Profile - This longitudinal profile graph is created using a Level 3 cross section dimensions feature class for the survey used to generate the bankfull estimate. This figure is produced by the R function
- Cross Section Metrics - This section displays metrics for the Level 3 dimensions calculated for the regular cross sections of a stream reach.
- Cross Section Metrics Plot, Level 3 - This stream reach metrics graph displays the Level 3 metrics on a faceted graph. This figure is produced by the R function
fluvgeo::xs_metrics_plot_L3. - Width Depth Ratio Map - A reach overview map is used to display the width depth ratio values at each cross section for the reach. The width depth ratio parameters (i.e., metric definition, class break values and labels) are defined in this report using the R S4 class
FluvialGeomorphicMetric. This figure is produced by the R functionfluvgeo::map_reach_metric. - Width Depth Ratio Graph - This graph displays the width depth ratio values (y-axis) of the stream along its length (x-axis) beginning from the downstream end of the reach moving upstream longitudinally. This graph uses the metric class definition for width depth ratio defined for the previous figure. This figure is produced by the R function
fluvgeo::xs_metric_plot. - Radius of Curvature to Bankfull Width Map - A reach overview map is used to display the radius of curvature to bankfull width ratio values at each cross section for the reach. The radius of curvature to bankfull width ratio parameters (i.e., metric definition, class break values and labels) are defined in this report using the R S4 class
FluvialGeomorphicMetric. This figure is produced by the R functionfluvgeo::map_reach_metric. - Radius of Curvature to Bankfull Width Graph - This graph displays the radius of curvature to bankfull width ratio values (y-axis) of the stream along its length (x-axis) beginning from the downstream end of the reach moving upstream longitudinally. This graph uses the metric class definition for radius of curvature to bankfull width ratio defined for the previous figure. This figure is produced by the R function
fluvgeo::xs_metric_plot. - Regional Hydraulic Geometry Curves Graph - This graph displays the channel dimensions of each cross section in the reach, along with the regional curve estimated dimensions. This figure is produced by the R function
fluvgeo::reach_rhg_graph.
- Cross Section Metrics Plot, Level 3 - This stream reach metrics graph displays the Level 3 metrics on a faceted graph. This figure is produced by the R function
- Cross Section Profiles - This section displays a focused view of the characteristics of each individual cross section in the stream reach.
- Cross Section Map - This map displays the extent of a single cross section in plan view with a high resolution DEM background. This figure is produced by the R function
fluvgeo::map_xs. - Regular XS Profile Compare Plot - This graph displays a single
*_L3_dimsfeature in a wide aspect ratio profile view to compare the elevations from multiple surveys if provided. This figure is produced by the R functionfluvgeo::xs_compare_plot_L2. - Bankfull Elevation Dimensions by Region Table - This table summarizes this cross section’s dimensions compared to several other regions at the current bankfull elevation. This table is created by code in the L3 Report,
fluvgeo/reports/level_3_report.Rmd.
- Cross Section Map - This map displays the extent of a single cross section in plan view with a high resolution DEM background. This figure is produced by the R function